
Dashboard explained
First, let’s start with what Fathom Analytics is: simple, GDPR-compliant website analytics that shows you data about your website on a dashboard or email report.
Here’s a video explanation of this content if you’re a visual learner.
To learn more about what analytics matter to your website, give our blog post on this subject a read.
If you want to visit a page or referrer from your dashboard To open a page or referrer instead of creating a filter, hold down Command (Mac) or Windows (PC) and click the link.
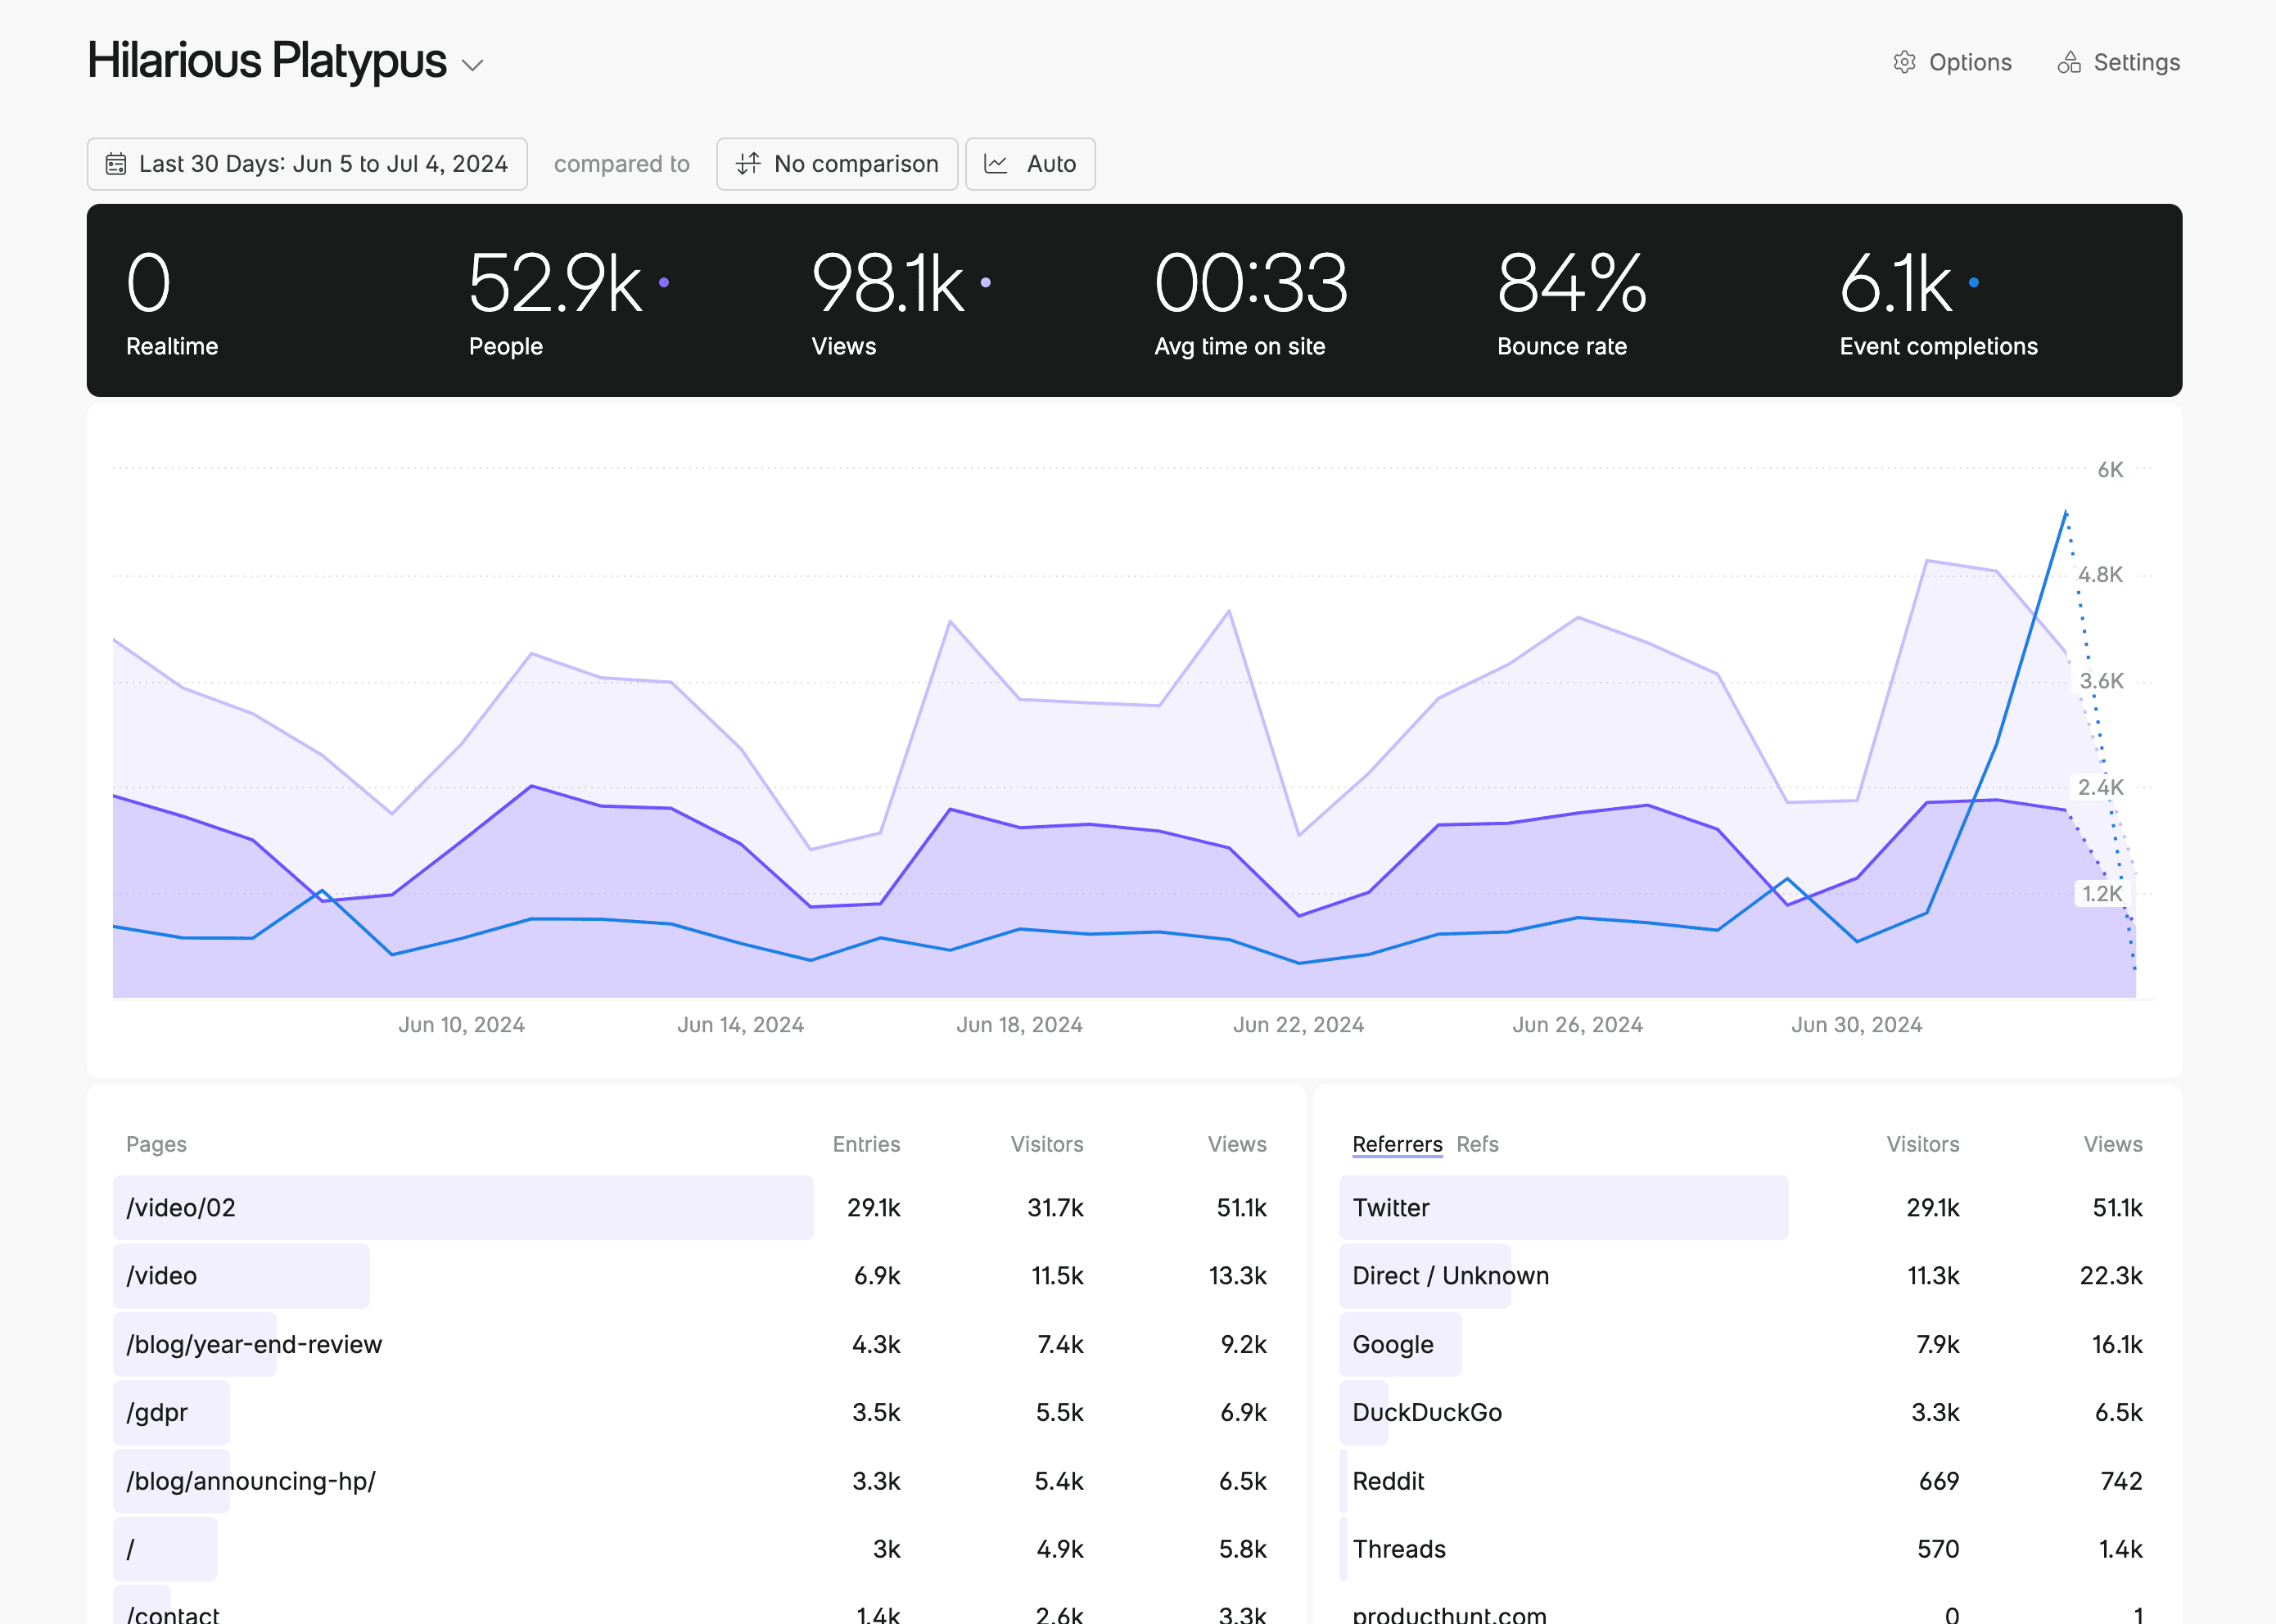
Using the dashboard
Time zones
Currently, we collect data in UTC +0 and then load your dashboard based on your local timezone. Our hashes for unique visitors are reset at midnight UTC +0.
Changing the graph
You can control what data the chart displays and how it’s grouped.
Toggling metrics: Click on a value in the totals box (the box with numbers at the top of your dashboard) to show or hide that metric on the graph. Available metrics include Site visitors, Views, Avg time on site, Bounce rate, and Event completions.
The metrics shown in the totals box change depending on your active filters. When you filter by a specific page, the totals update to show metrics for that page (e.g., Page visitors and Avg time on page). When you filter by an event, the totals switch to show event-specific metrics like completions, unique completions, conversion rate, and value.
Chart type: Use the chart type dropdown (top-right of the chart) to switch between an Area chart and a Bar chart.
Date grouping: Use the date grouping dropdown to control how data points are aggregated on the chart. Options include Auto, Hourly, Daily, Weekly, Monthly, Quarterly, and Yearly. The available options depend on your selected date range — for example, Hourly is only available for date ranges under two weeks, and Yearly only appears for ranges over two years.
When “Auto” is selected, the chart automatically picks the best grouping for your date range — hourly for single-day views, daily for shorter ranges, and monthly for ranges over six months.
Comparison mode
Click ”+ Add Comparison” next to the date picker to open a comparison period selector. You can compare against the Previous period, Previous month, Previous quarter, Previous year, or pick a custom date range. Once a comparison period is selected, every metric across the dashboard shows the change. In the totals box, the change appears on a dedicated line below each metric (e.g., “+12% vs previous”). You can click on any metric in the totals box to toggle it on the chart, where it will display the current and comparison period data together for an easy visual comparison.
Details view
When you click the icon in the bottom/left of any box on your dashboard, you can see the details of that box. The details page shows you 100 rows per page and includes extra details like bounce rate and average time on page.
Secondary dimensions: In the detail view, you can add a secondary dimension to break down your data further. Click the “Secondary dimension” dropdown next to the search field to split your data by an additional dimension such as Browser, Country, Device Type, or UTM parameters. Each unique combination appears as its own row, and you can sort by any column including the secondary dimension. This lets you answer questions like “which pages are most popular on mobile devices?” without leaving the dashboard.
Search Console mode
If you’ve connected Google Search Console to your Fathom account, the chart can display search performance metrics: Clicks, Impressions, CTR, and Average Position. This gives you a complete picture of how people find and interact with your site, all in one dashboard.
Dark mode
By default, the dashboard uses your system’s colour preference to choose light or dark mode (Automagic). You can override this directly on the dashboard by opening the options menu and selecting Auto, Light, or Dark. The same setting is also available under Settings > Account > Colour mode.
Metrics
What is a Site visitor?
Site visitors is the number of unique individuals who visited your website during a 24-hour period.
For example, if Sally and John both visit your site and each clicks on three pages, you’ll see 2 Site visitors (Sally and John) and 6 views (two people × three pages each).
To protect privacy, we reset how we identify a person every 24 hours (you can read about salts and hashes here).
What is a page visitor?
Page visitors (in the Pages box) are the number of people who visited a specific page on your site. Each page Sally or John visits counts as one unique page visitor. If either of them visited the same page twice, it’d still only count as a single page visitor, but it’d result in multiple views.
What are views?
Views are the number of times a page loads on your website. So in the above example, Sally and John visited three pages each, so it’s six views total.
Note: views are essential to understand since our pricing plans are based on page views (average number of views per month, plus event completions and API requests).
How is average time on site calculated?
Average time on site measures the average total time each visitor spent on your site during their session, from their first pageview to their last recorded activity. This is the default time metric shown in the totals box at the top of the dashboard.
We track whether the browser tab is actually visible (not backgrounded), so time spent with the tab hidden doesn’t inflate your averages. For a deeper explanation of how time metrics and departure pings work, see how Fathom measures your analytics.
How is average time on page calculated?
Average time on page measures how long visitors spent on a specific page before navigating away. You’ll see this metric per page in the Pages detail view, and it also replaces “Avg time on site” in the totals box when you filter by a specific page.
For example, if Sally visits your homepage and navigates away after 3 minutes, and John visits the same page and leaves after 1 minute, the average time on that page is 2 minutes. Tab visibility tracking applies here too, so backgrounded tabs don’t inflate the number. See how Fathom measures your analytics for more detail on how departure pings work.
How is bounce rate calculated?
We figure out bounce rate by looking at single page sessions and then dividing by total sessions. Fathom uses a 24-hour session window, so a visitor who leaves and returns later the same day is not counted as a bounce.
For example, if 100 people visited your site and 50 left after only visiting a single page, your bounce rate is 50%. For more on how bounce rate is calculated, see how Fathom measures your analytics.
How are events calculated?
Events (or goals) in Fathom are things you want to collect data about, which aren’t just page views. Button clicks, form submissions, and even e-commerce can be set up as events in Fathom.
Conversion rates for events are calculated by taking the number of times the event was triggered and dividing it by the total number of page views.
Unique completions are the number of times a visitor completed an event (since visitors are unique people).
What is “Realtime”?
Realtime shows how many people are actively viewing your site right now. Click it to open a purple box showing which pages they’re on and where they came from (referrers).
Realtime data updates in 5-minute intervals. If someone stays on a page longer than 5 minutes, they’ll drop out of the realtime count. If they move to another page, they’ll show up again.
Dimensions
The dashboard breaks down your data across several dimensions, each shown in its own box. You can click into any of them to see a detailed view.
Pages
Shows which pages on your site are being visited, along with their visitor count and pageviews. If you have multi-domains enabled, you’ll also have a Domains tab that lets you see traffic broken down by domain.
Entry & Exit Pages
Entry Pages show the first page a visitor lands on when they arrive at your site. Exit Pages show the last page a visitor views before leaving. These help you understand where people start and end their sessions.
Referrers
Shows where your visitors came from. The Referrers tab groups traffic by the referring domain.
Direct/unknown in the Referrers box shows how many people visited your site without a referrer set. That could mean they came directly to your site (i.e. they typed in your URL), came from an email or app, or a referrer simply wasn’t set (some sites do this, and no analytics software can control it).
Sources
Classifies your traffic into categories — Organic, Social, Paid/campaign, or Direct — so you can see at a glance how visitors are finding your site. For more info, see the sources documentation
Refs
A “ref” parameter in a URL (e.g., ?ref=mysite) indicates the referral source that directed a visitor to your site. If your site has the Refs tab enabled, you can see traffic broken down by these ref parameter values.
Device Types
Shows the devices visitors are using to access your site — Desktop, Mobile, or Tablet.
Operating Systems
Shows the operating system breakdown of your visitors (Windows, macOS, iOS, Android, etc.).
Browsers
Shows which browsers your visitors use (Chrome, Safari, Firefox, etc.).
Locations
Shows where your visitors are located, with tabs for Countries, Regions, and Cities.
Events
Shows your event completions, unique completions, and conversion rates. Events are things you want to track beyond page views — button clicks, form submissions, e-commerce transactions, and more. For more info on setting up events, see the events documentation
UTMs
Shows traffic from UTM-tagged campaigns, broken down by Campaign, Source, Medium, Content, and Term. For more info, see the UTMs and campaign documentation