
Web Analytics Metrics You Should Use to Win More Customers
Paul Jarvis · Feb 14, 2023Achieving website success is a real challenge. Many of us get quickly overwhelmed by the hefty amount of data that is presented to us as soon as we open the majority of web analytics tools out there (we are looking at you, Google!).
And let us tell you something: website analytics matter more than ever.
Staring at your website analytics tool for hours is not going to move the needle - it’s crucial to comprehend the meaning of these metrics to obtain precious insights that help you tailor your marketing efforts accordingly.
This in-detail guide will show you the main web analytics metrics to look into so you can get more customers, so let’s quickly dig in.
The Importance of Web Analytics Metrics
Completely ignoring the impact that website metrics have on your website can result in a lack of understanding of your audience and hinder your growth.
This is why it’s worth investing your time to monitor website analytics metrics, have a better understanding of your content and tailor this information to achieve your business objectives.
The results of your analysis will help your project in vital aspects, such as the following:
- Identify performance issues on your website (products, conversions, and more).
- Have a clear understanding of the user journey on your site.
- Learn more about your audience to comprehend what’s working and what isn’t.
- Improve the implementation of strategies with your marketing team.
- Win more clients or sales over time.
What Tool Should You Use to Track Web Analytics Metrics?
There are two ways to start tracking your website data: either use the most standardised web analytics tool out there (Google Analytics), or a simple web analytics tool, such as Fathom.
Most tracking tools pull data from your website without prioritising simplicity and user privacy, which is not something particularly advisable in a world where European regulators consider Google Analytics to be illegal.
But beyond privacy concerns (which should not be taken lightly), most people will stare at their Google Analytics dashboard and not know what to do due to the complexity of the main user interface.
That’s not a problem that Fathom Analytics customers have: we value both privacy and simplicity while collecting data that helps you easily comprehend your website engagement metrics.
Projects that fail to use website analytics metrics as part of their marketing efforts will be one step behind their competitors.
Fathom Analytics is here to change that.
11 Web Analytics Metrics You Should Use to Win More Customers
So which metrics should you track for your key performance indicators (KPIs) to pave the way to winning more customers and increasing conversions on your website?
Whether you use Fathom Analytics, GA4, or other website analytics tools, here are our recommended, vital web analytics metrics.
1. Website Visitors
Website visitors refer to the total number of people who visit your site.
Web traffic data helps you understand how many people are visiting your site in a given timeframe.
In Fathom you can see how much traffic you have gained (or lost) over the course of weeks, months, or years.
As a rule of thumb, more traffic leads to more potential customers. However, some visitors often use ad-blockers that successfully prevent tools such as Google Analytics from tracking their traffic, which results in inaccurate reporting.
2. Web Pageviews
Web pageviews are the total times any web page on your website is visited by either unique visitors or returning visitors.
Unlike web traffic, which is represented as a whole, pageviews is one of the most important website metrics because it let you see what particular page is getting the most views on your site.
This is one of the key metrics to track to get more customers because it allows you to identify your top-performing pages.
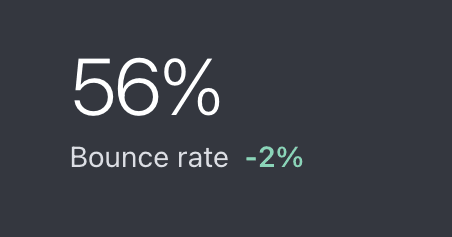
3. Bounce Rate
Understanding the concept of bounce rate is quite simple: it’s the number of people that visit one page and leave without clicking on any other pages. Google defines bounce rate as “the percentage of sessions that weren’t engaged sessions.”
If 50 people visit a page, and 25 leave without engaging with your website, your bounce rate will be 50%.
Bounce rate is important because it shows you how site visitors interact with your site or products.
Although there are other metrics that have a great impact on bounce rates as well, such as UX and website performance, this factor helps you to see the bigger picture on your pages.
- If your bounce rate on landing pages is too elevated, it might mean that users are not finding what they are looking for.
- If the bounce rate is lower than average on a certain page, it might mean that visitors are interested in engaging with it.
Adjusting your strategy based on bounce rate is a smart way to win more customers, and, therefore, more conversions.
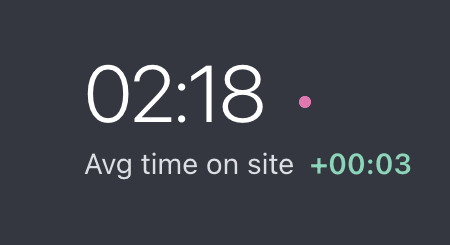
4. Average Time on Page
Average Time on Page, also referred to as Average Session Duration, calculates how much time a visitor was active on a certain page of your website.
The average time a person spends on a page shows you how interested your visitors are on your content or products.
If you have long-form blog posts that people can read in 10 minutes, but the average session duration is just 1 minute, it means that they are not reading the post in its entirety.
You can use average time on page for A/B testing your landing pages - the landing page that keeps your visitors longer is probably the one you should keep.
5. Average Pageviews Per Session
Average Pageviews Per Session measure how many pages of your website a visitor browses during the same session.
Imagine that you have an eCommerce store with multiple products that can be browsed.
The more pageviews they browse, the more likely they are to take action on your website.
Understanding your average pageviews per session alongside other different website metrics helps you improve your site’s user journey through multiple pages, which ultimately leads to more clients or customers.
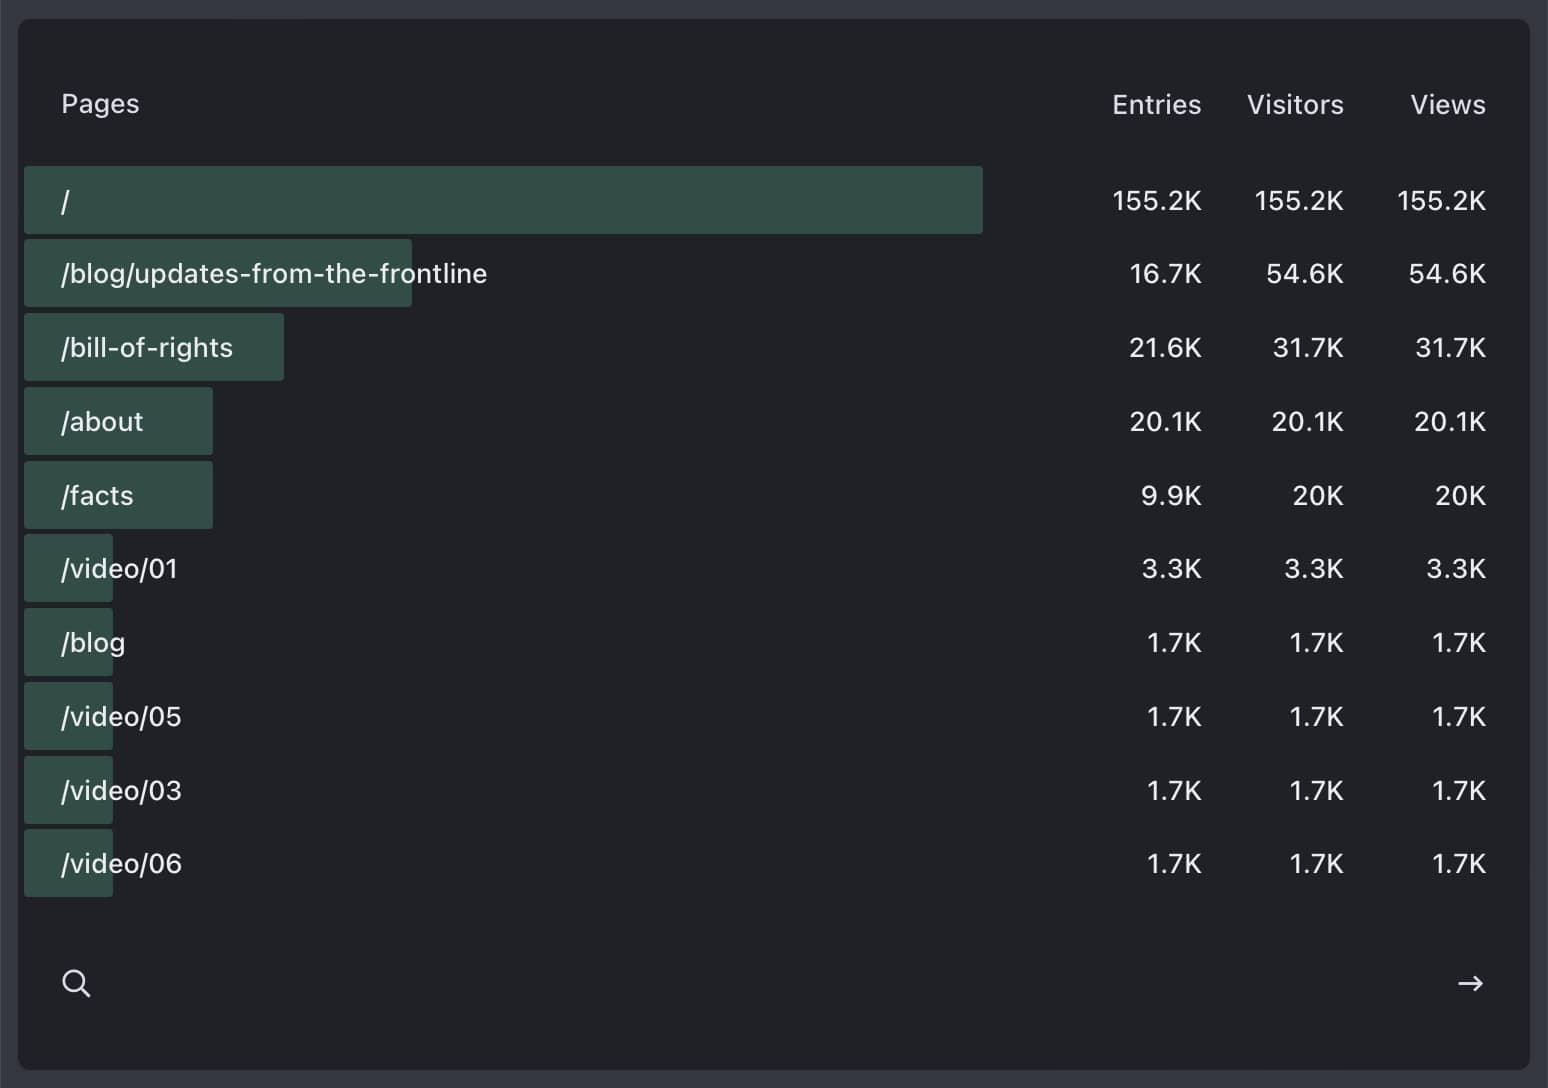
6. Top Entry Web Pages
In Fathom Analytics, the “Entries” parameter helps you measure the number of visitors who landed on a specific page of your website for the very first time.
This can help you track the efficiency of your landing pages compared to, for instance, product pages or blog posts.
By understanding the top pages that your visitors first see when they come to your website, you’ll be able to use your marketing tools to improve or optimise these pages accordingly.
Are there landing on the pages that are most profitable for your business? Do visitors see informational content first instead of product pages?
All this information can be used to tailor a strategy that ultimately leads to increasing your conversion rate based on the first interaction that visitors have with your website.
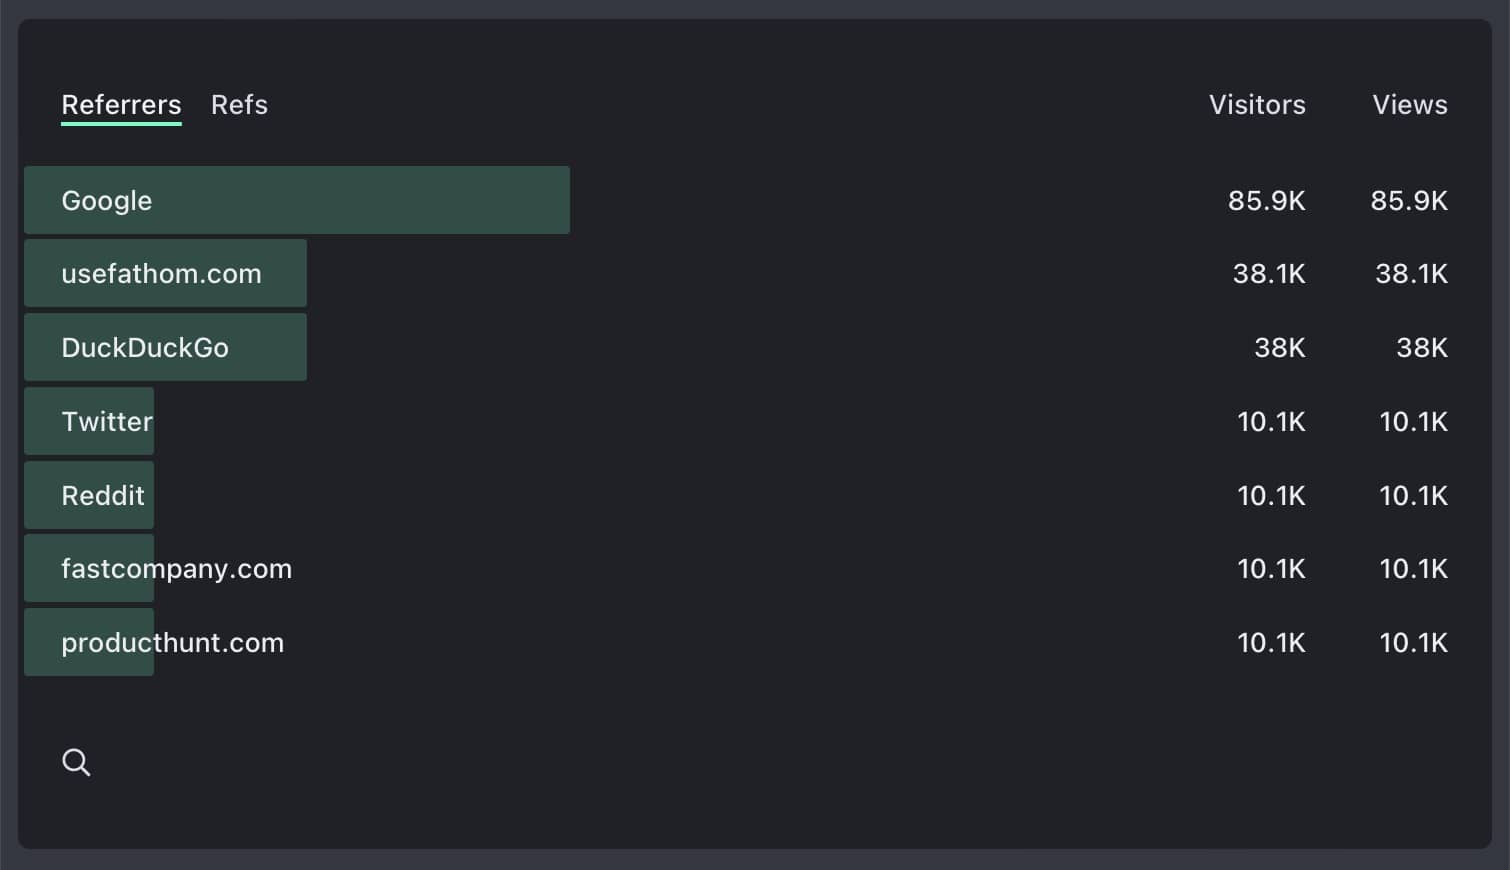
7. Referral Traffic or Traffic Sources
Referrals, also referred to as traffic sources, are the website or mediums that people use to get to your site through clicks.
Understanding your main traffic source helps you make sense of other metrics that affect the efficiency of your website.
In Fathom Analytics, we use the Referrers Tab to show you each traffic source to your website.
Are people finding your site on Google’s Search Engine Results Page? This means that search engines consider your content to be useful and relevant and, therefore, boost your organic search traffic.
Is your website getting many referrals through a social media channel, such as Facebook or Instagram? Then your social media campaign is working, or, if this isn’t your case, then you need to change your campaign accordingly.
This information helps you make the necessary adjustments to improve your traffic channels based on how people find and access your site.
But some direct traffic sources “delete” the referrer’s data when sending traffic to your site, which might result in data inconsistencies.
This can happen in some social media campaigns or newsletters, and it’s defined as “dark traffic,” which is traffic to your site misattributed to direct.
Our solution?
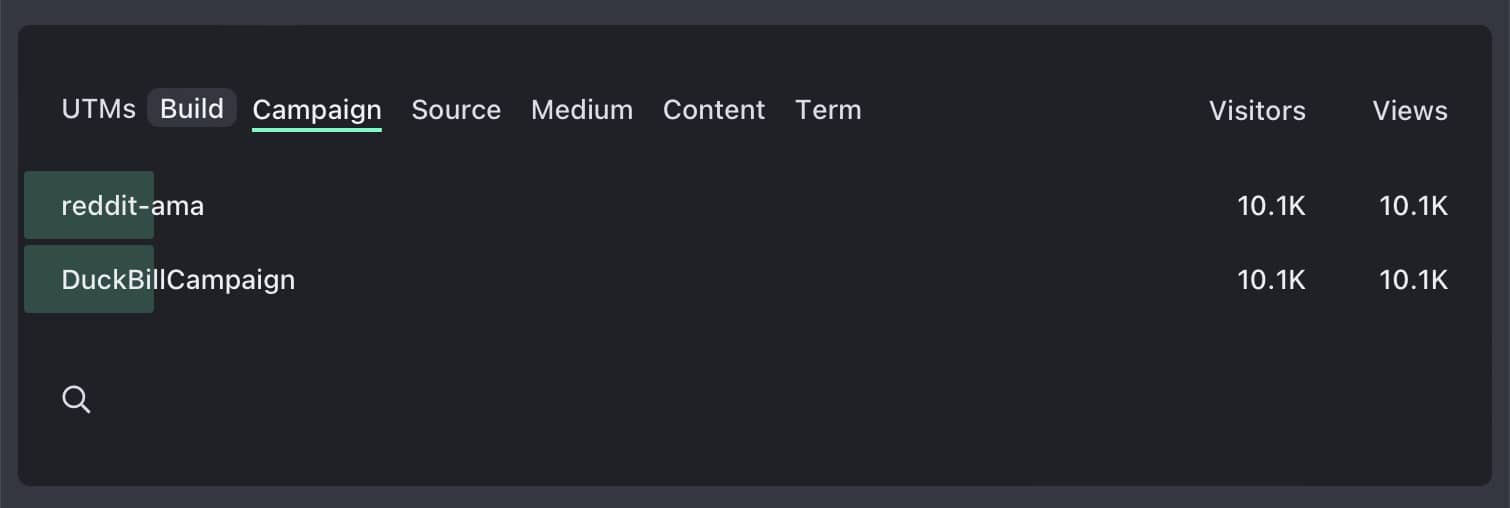
Fathom Analytics lets you add UTM Tags to your links so you can have proper insights regarding your referral traffic as a whole and not partially.
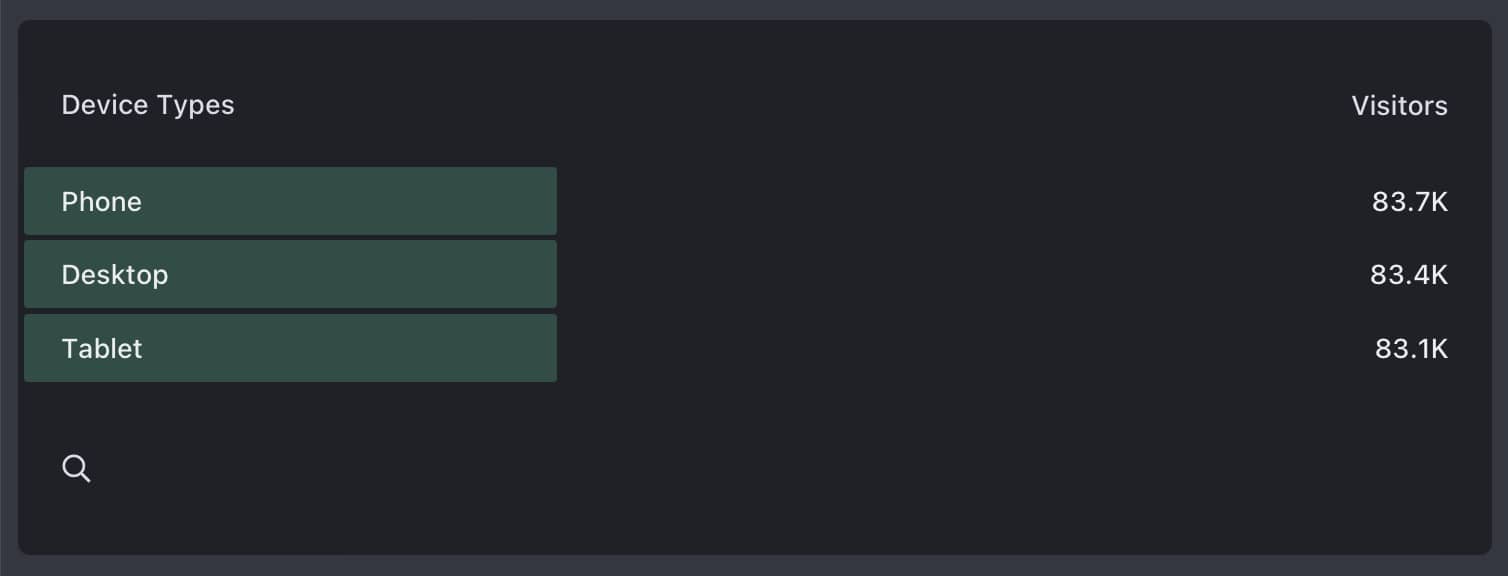
8. Device Type
What device are your visitors using to browse through your website? Are they using mobile devices, desktop computers or perhaps even tables?
If more people are browsing your site through a mobile device, then improving UX and design to satisfy mobile visitors is a good call.
On the other hand, if you have more desktop users, you can can prioritize desktop UX over a mobile one.
Mobile traffic represents more than half of website traffic worldwide (around 58%), so keep an eye on these statistics.
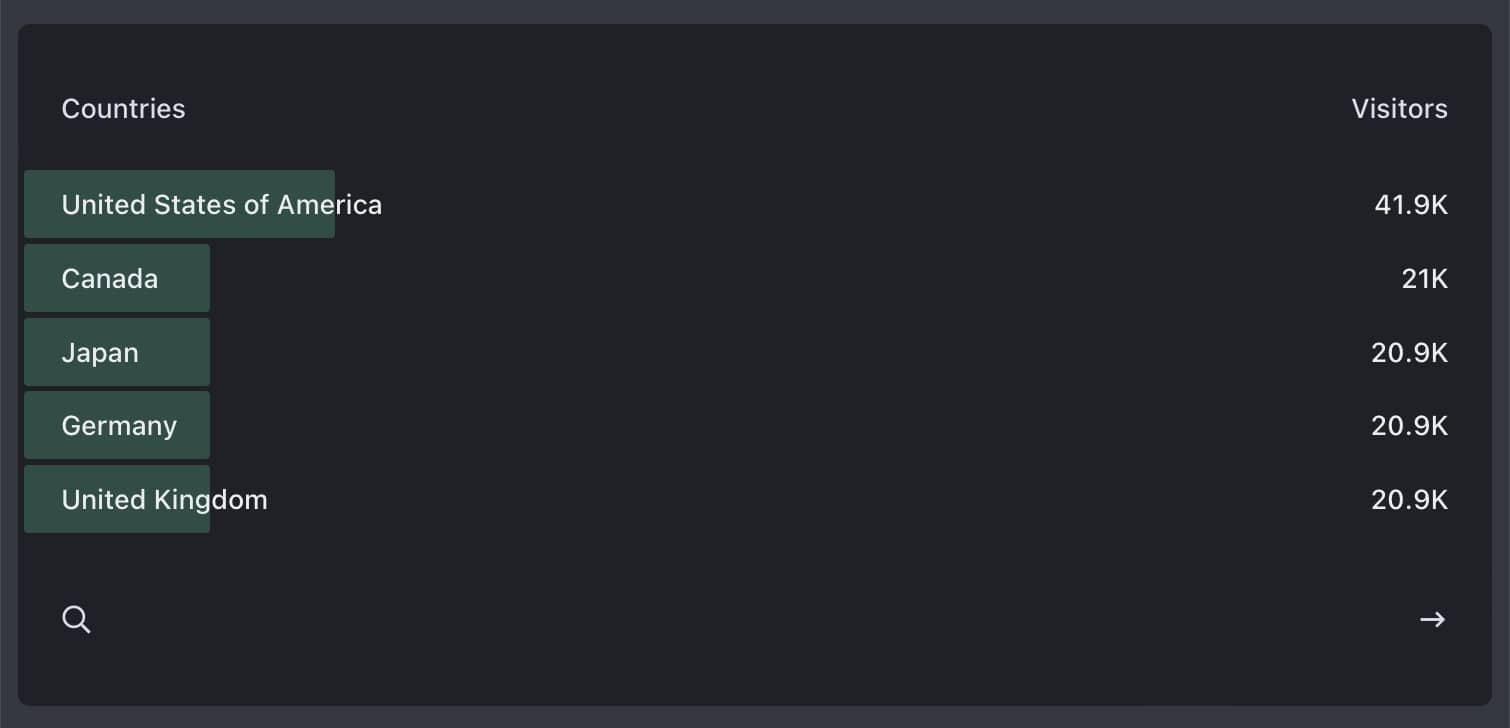
9. Location and Browser Type
Where do most of your visitors come from? Are you getting traffic mostly from the country where your audience is? What browser do they use to access your website?
If you are expecting visitors from countries other than the ones you’ve got, then perhaps you are not targeting the right search intent, content type, or product.
With Fathom, you can quickly see where your visitors coming from as a number of visits or percentage of each country.
We also show you the most popular browser type that people use to visit your website.
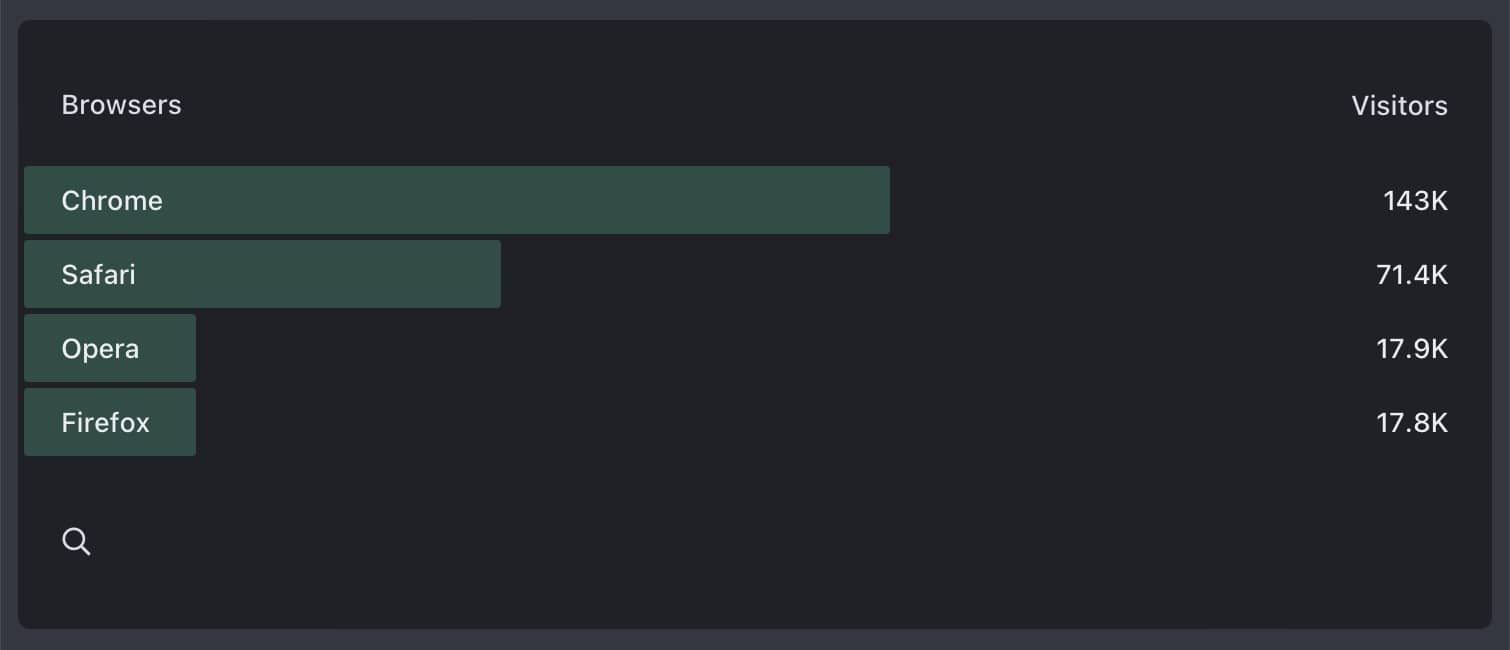
This information can help you test your site’s design on different browsers to improve UX.
You can also extrapolate this data to prioritize content.
For instance, if you are getting a lot of mobile users coming from Safari, you can use this information to showcase them relevant products. If you sell “phone cases,” you can prioritise Apple iPhone phone cases over Android phone cases.
10. Conversion Rate
Conversion Rate is considered by many as the most important web analytics metric for online businesses.
Whether we talk about unique or repeat visitors, it doesn’t matter if you have over 1 million visitors if none of them converts.
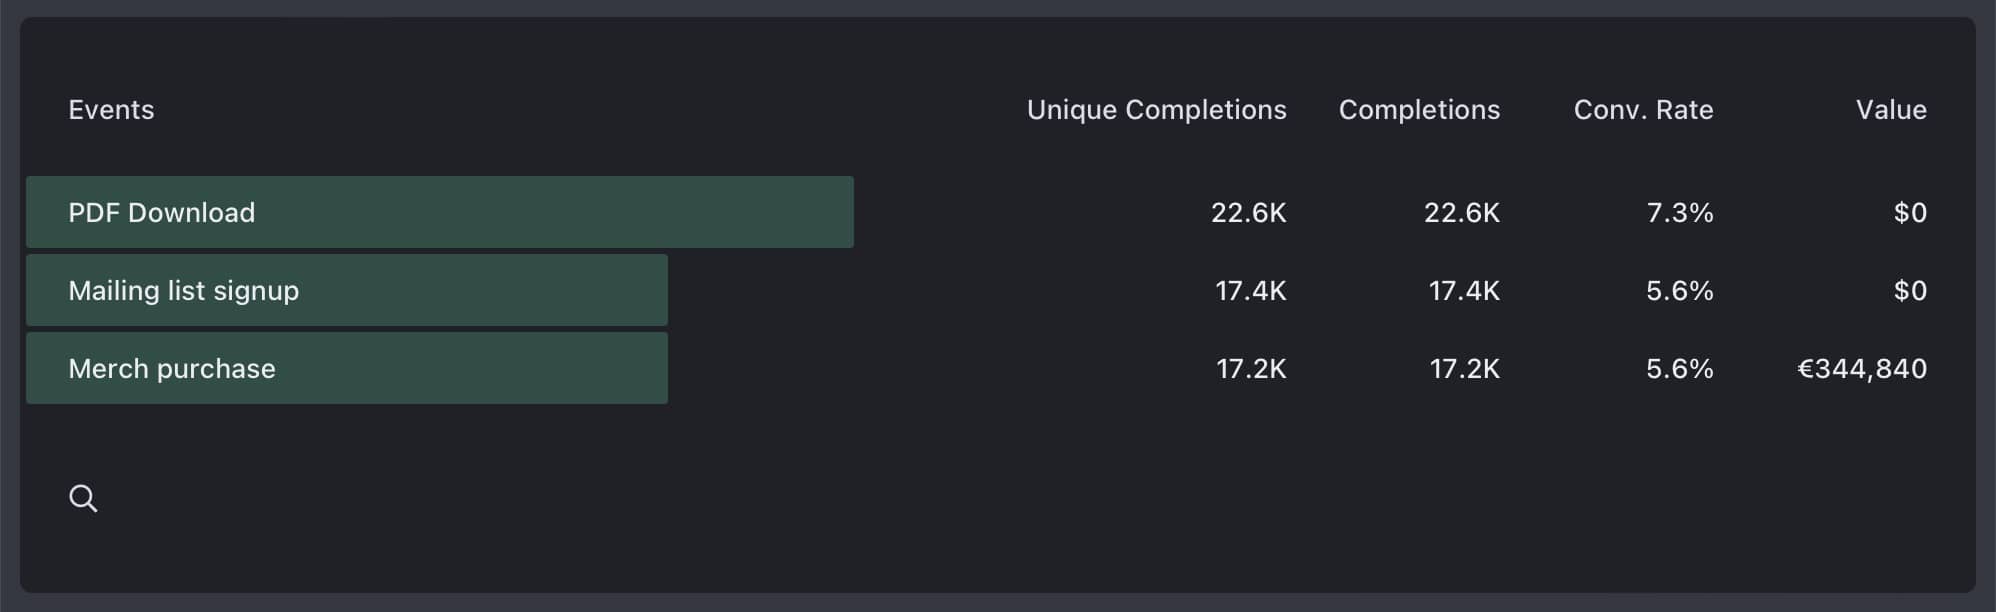
Conversion Rate shows percentage of people who complete specific tasks on your site, such as purchasing a product, subscribing to a newsletter, downloading a file, and more.
Fathom Analytics customers can track their conversions in a straightforward way through Event Tracking.
Fathom Analytics allows you to create events measured through buttons, links, product purchases, newsletter clicks, file downloads, and more.
The total number of views on a section or page with a tracked event divided by the number of times the event was completed will show you your conversion rate.
Conversion Event Tracking doesn’t have to be a complicated task - we simplify it so you can analyse the data and determine the best course to follow for your website.
11. Top Exit Pages
Your top exit pages are the pages through which your visitors are abandoning your website.
If some of your product pages also happen to be part of your top exit pages, it means that users are not finding what they are looking for there.
If your home page of your ecommerce store is on your exit pages list, then it means that people cannot easily navigate to certain products and, hence, will not take action on your site.
Identifying your top exit pages helps you in decision-making processes during your marketing strategies and funnel optymisation. That’s why showing you exit pages in Fathom Analytics is on our roadmap (we’re committed to building this feature and will be doing so soon).
Wrapping Up: Improve Your Marketing with the Power of Analytics Metrics
Website analytics are here to change how we comprehend the visitor journey on our website.
Thanks to Fathom Analytics features, our customers are able to understand their metrics to later make data-driven marketing decisions that will improve their KPIs and make them win more customers.
Figuring out what metrics have the most significant impact on the success of your business doesn’t have to be a headache - Fathom Analytics makes things simple enough for our customers to rely on privacy-focused data in an efficient, useful, and straightforward way.

BIO
Paul Jarvis, author + designer