
Engagement Rate in Google Analytics 4: All You Need To Know
Paul Jarvis · Feb 28, 2023The change from Universal Analytics to Google Analytics 4 has brought us brand-new metrics that website owners and marketers now have access to.
Back in UA, the main engagement-based metric that site owners looked at was bounce rate.
Now, GA4 integrates different engagement rates, sessions, time, and other engagement metrics that help us understand how users interact with your pages.
Let’s discover and unleash the potential of engagement rate in Google Analytics 4 in this in-detail guide.
What Is Engagement Rate Google Analytics 4?
Engagement rate is defined by Google as the percentage of sessions in one page that were engaged sessions.
There are three parameters that determine if a session is an engaged session or not. Essentially, an engaged session is:
- A page view session that lasted 10 seconds or longer.
- A session that triggered at least 1 conversion event.
- A session that has 2 or more page views per session.
These are all considered engaged sessions and count towards engagement rate and other metrics implemented by Google in GA4.
In Universal Analytics, engagement on website was measured by bounce rate. Bounce rate is the percentage of sessions on a given page in which there were no interactions with that page.
For example, if a user visited a page on your website, but left the page without taking an action (like clicking a link), then that session will count towards the bounce rate.
Per definition, bounce rate is the inverse of engagement rate: bounce rate is calculated based on non-engaged sessions, and engagement rate is calculated based on engaged sessions.
There are other website’s engagement metrics introduced by Google that we need take into account:
| Metric Name | Description |
|---|---|
| Engaged Session | Engagement Sessions take place when pageviews last more than 10 seconds, users visit other pages on your site, or they trigger conversion events. |
| Engaged Sessions Per User | Engaged Sessions Per User is the overall number of engagement sessions that users have on your website on average over a certain time period. |
| Engagement Time | Average Engagement Time is the average session duration of an engaged session on your site. |
| Engagement Rate | Average engagement rate data is calculated based on user engagement actions on your website (long visits, clicks, events, and more). |
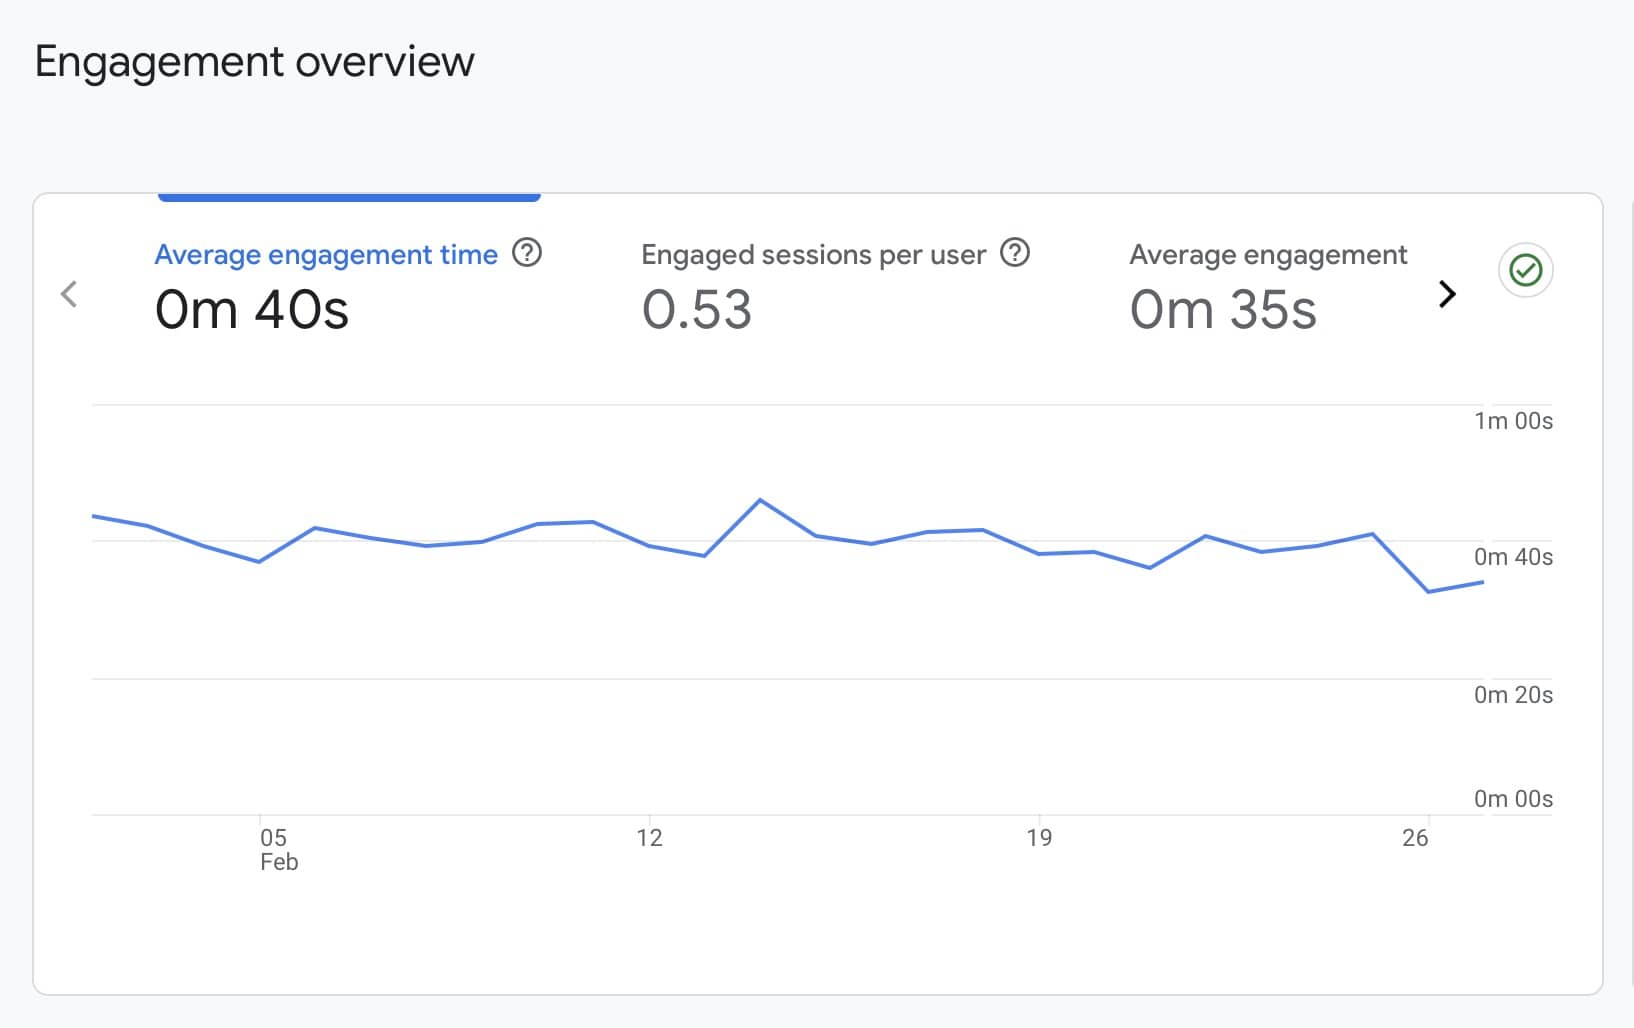
You can see these different engagement rate metrics by checking the Engagement Overview on your Google Analytics 4 panel.
How GA4 Calculates Engagement Rate?
The engagement rate formula implemented by Google is the following:
Engagement rate = Number of Engaged Sessions / Total Number of Sessions * 100.
By calculating the total number of engaged sessions and dividing it by total sessions (engaged or not), GA4 calculates your website’s engagement rate expressed in percentages.
If you had 15,000 total sessions on a website page, and 800 of those sessions engaged with your site, then your engagement rate would be:
(800 / 15,000) * 100 = 5.3%.
What Impacts Engagement Rate?
Engagement rate is impacted by the percentage of users who interact with a web page. If users do not find the page useful, they will leave without triggering events (remember that GA4’s data model is event-based).
When looking at your engagement rate, you should focus on how this metric can help you in the following factors:
- See the efficiency of a traffic source: are users who open your site from Facebook engaging with your site more than users from search engines?
- Analyze marketing campaigns: measuring user satisfaction through engagement rates can help you improve your current marketing efforts to increase user engagement and meet their expectations.
- Improve conversion rates: since engagement rate is also determined by events triggered (conversions), it is possible to use this information to identify opportunities that can lead to a high engagement rate. In general, high engagement rates lead to more overall conversions.
What is a Good Engagement Rate?
Multiple industries will have different definitions of good and bad engagement rates.
According to Hootsuite, experts agree that a good engagement rate is between 1% and 5% on most social media platforms. This can be considered a low engagement rate in different industries.
On websites and online businesses, on average, a good engagement rate is somewhere between 60% and 70%.
So, to answer this question: It depends. “Good” engagement rate varies based on the nature of the product or service, the ultimate business goals, the industry type, and the target audience.
It’s important to analyze, comprehend and interpret engagement rate and other engagement metrics to craft a custom strategy that can positively impact user engagement on your website.
Where Do I Find Engagement Rate in GA4?
Engagement rate metrics provide valuable information related to your website content. It can also help you identify your most important pages and the type of content that is consistently engaging users.
But how do you find your engagement rate on GA4? You can find engagement rate in GA4 by following five simple steps.
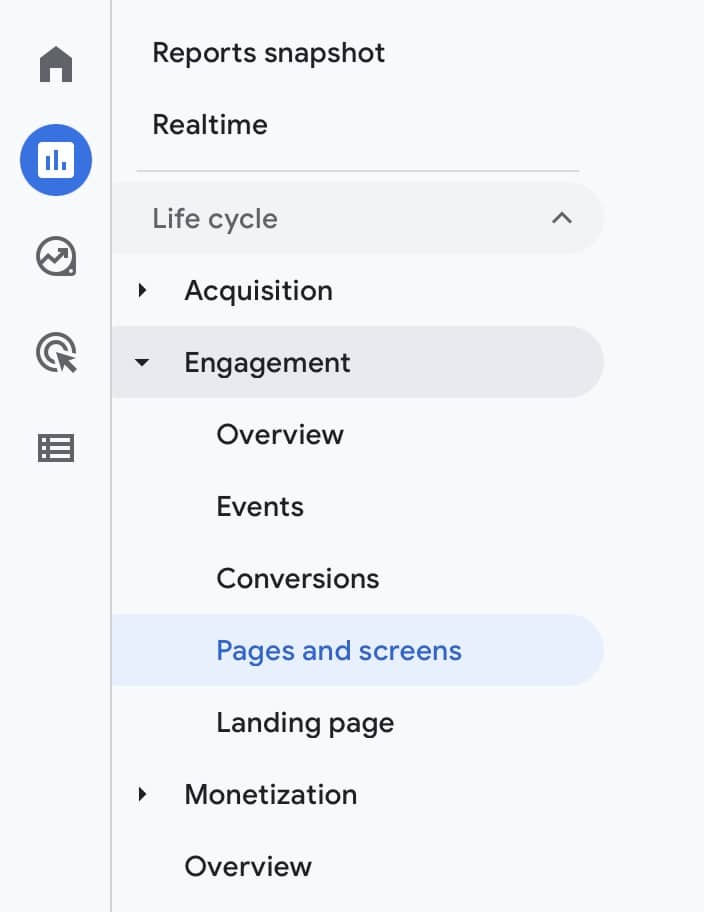
Step 1: Open Your Google Analytics 4 Account and Go to Reports
Open your Google Analytics 4 Account and look for the Reports option at the left hand side panel.
Here, open the Engagement drop-down menu, and select “Pages and Screens” report.
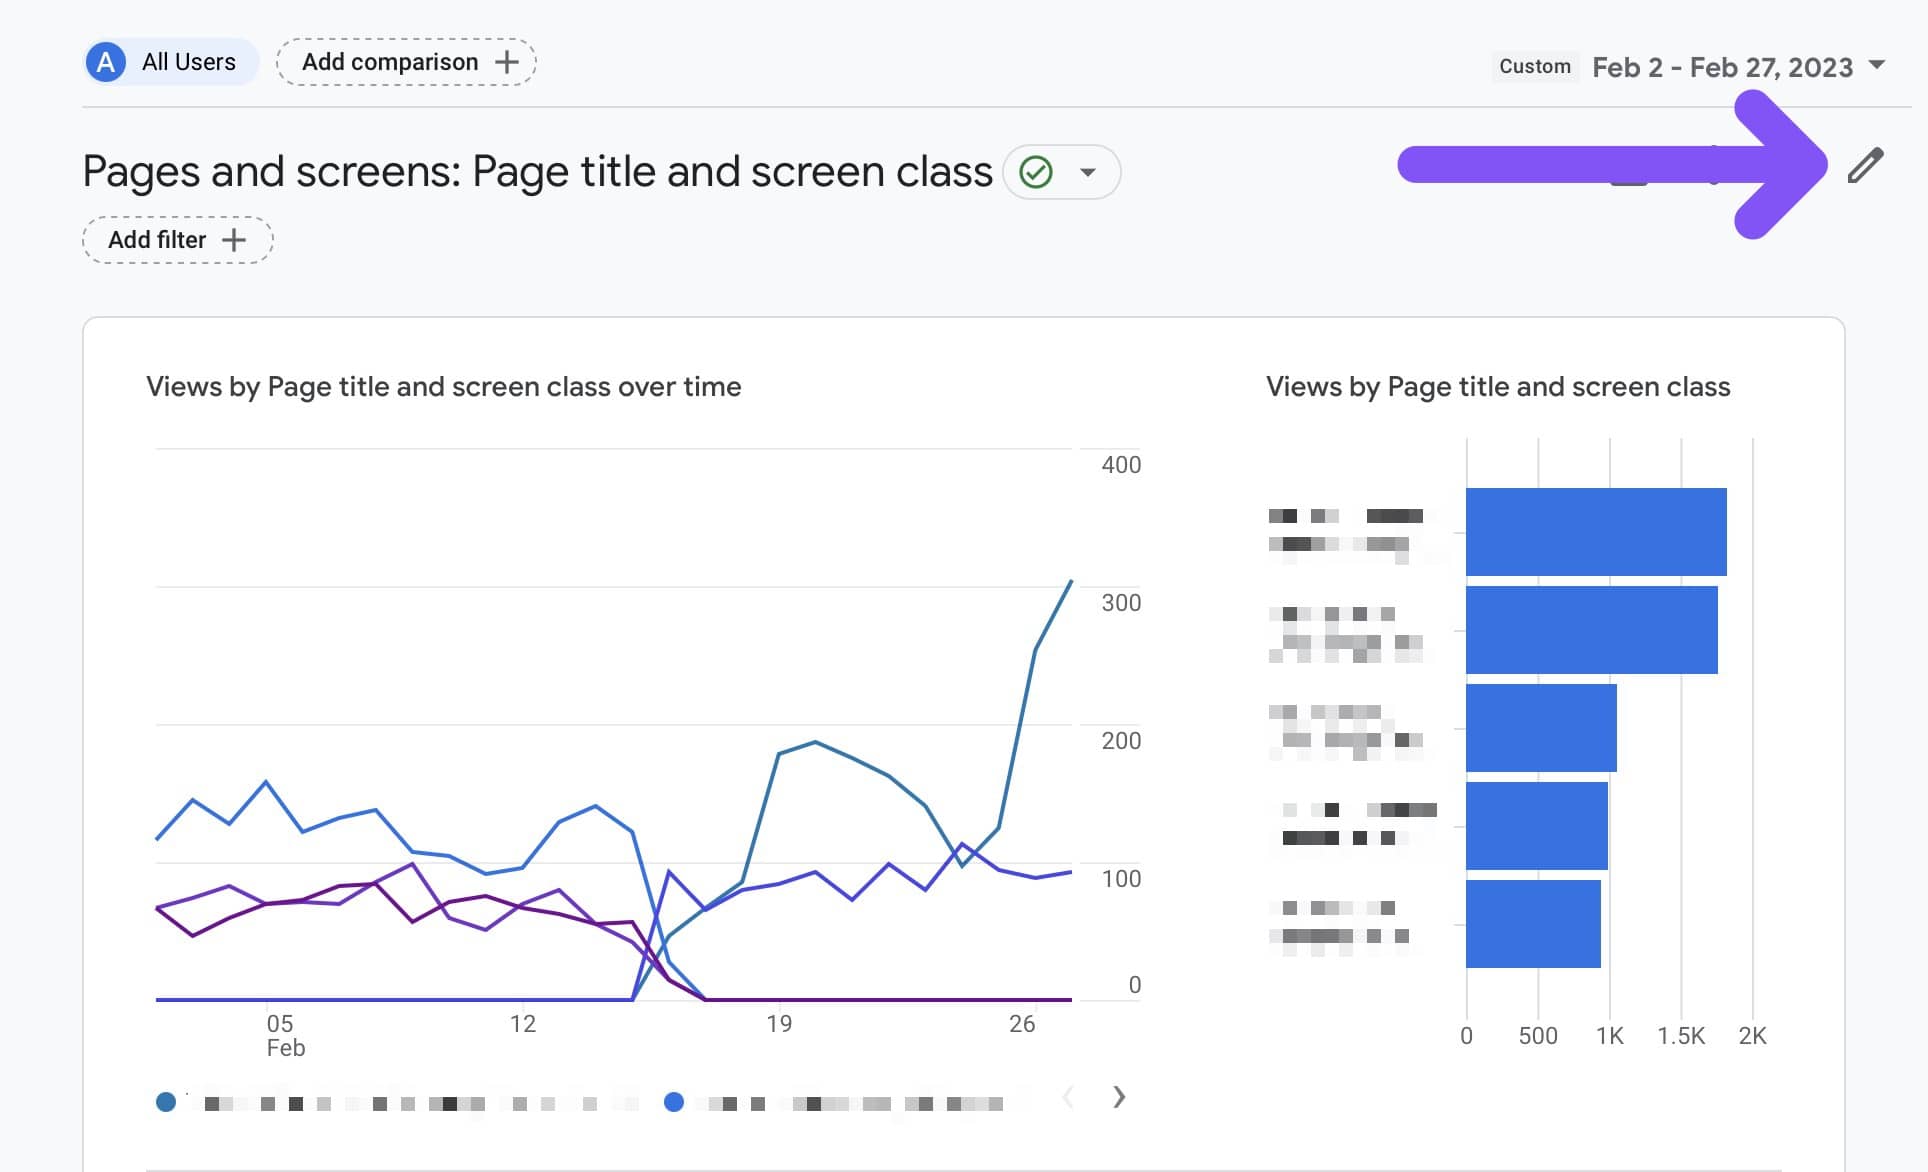
Step 2: Click the Pencil Icon to Customize Engagement Report
Click on the little pencil icon that appears at the top right corner of the report graphic. This will allow you to edit the report based on your needs.
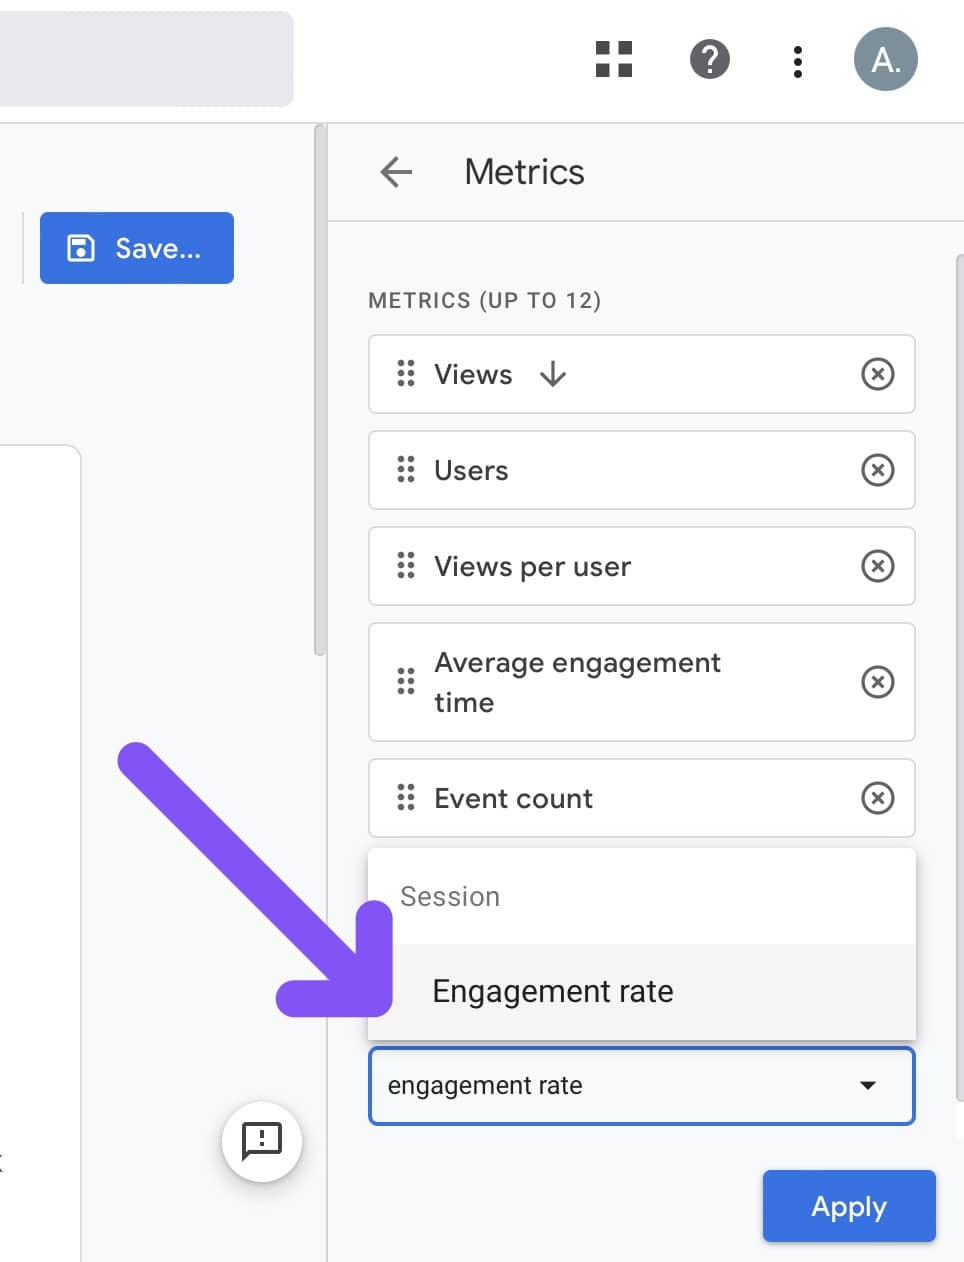
Step 3: Add Engagement Metrics to the Report
After clicking the Pencil Icon, you will see an option to Customize the report. There, select Metrics.
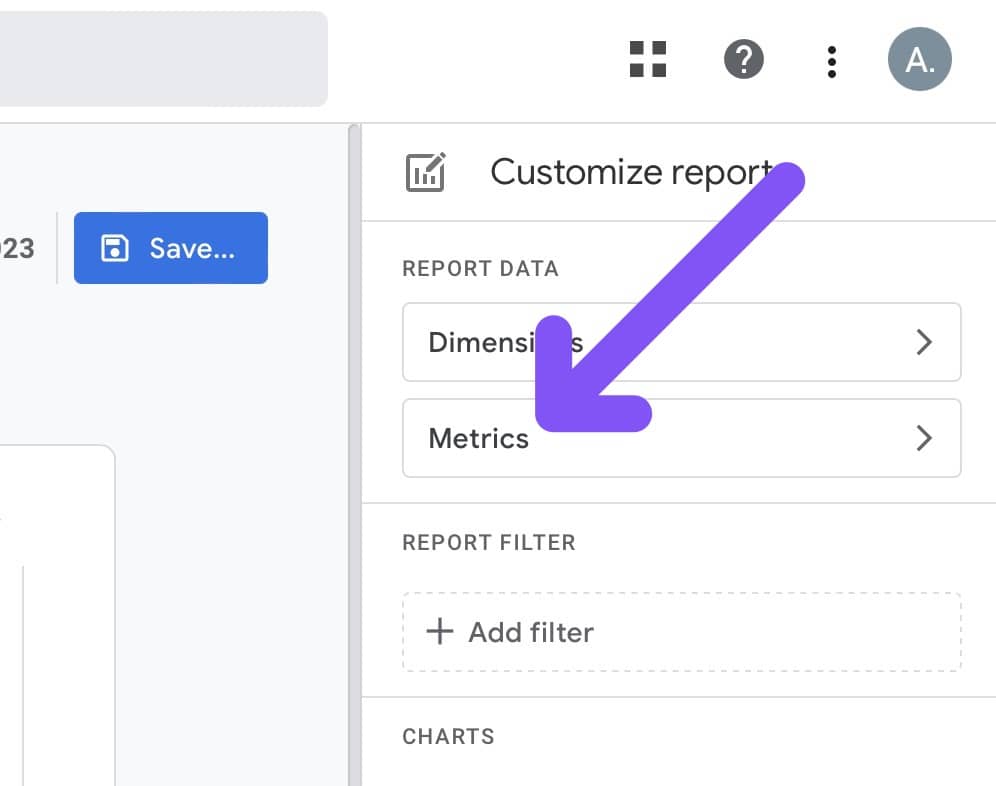
You can add up to 12 metrics to your Engagement Report. In the “Add Metric” search bar, look for “Engagement Rate” and add it by clicking “Apply.”
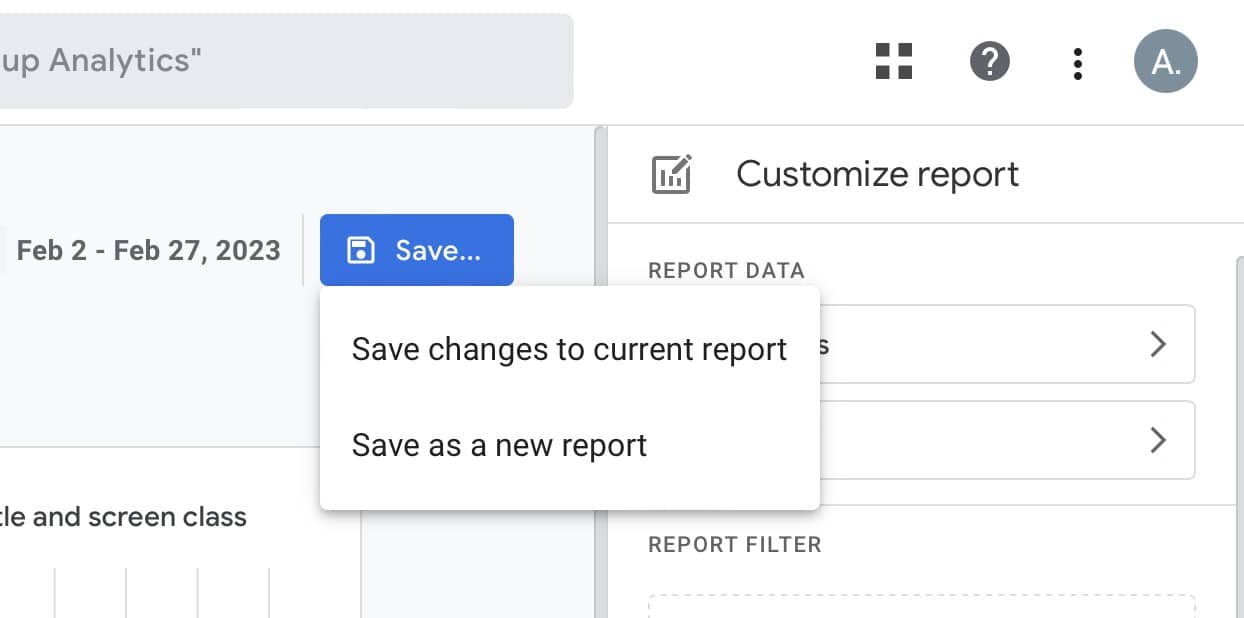
Step 4: Save the Changes and Go Back
Go to the report graphic, and click Save. You can either select “Save Changes to Current Report” or “Save as a New Report.”
Click the option of your preference, and select “Go Back.”
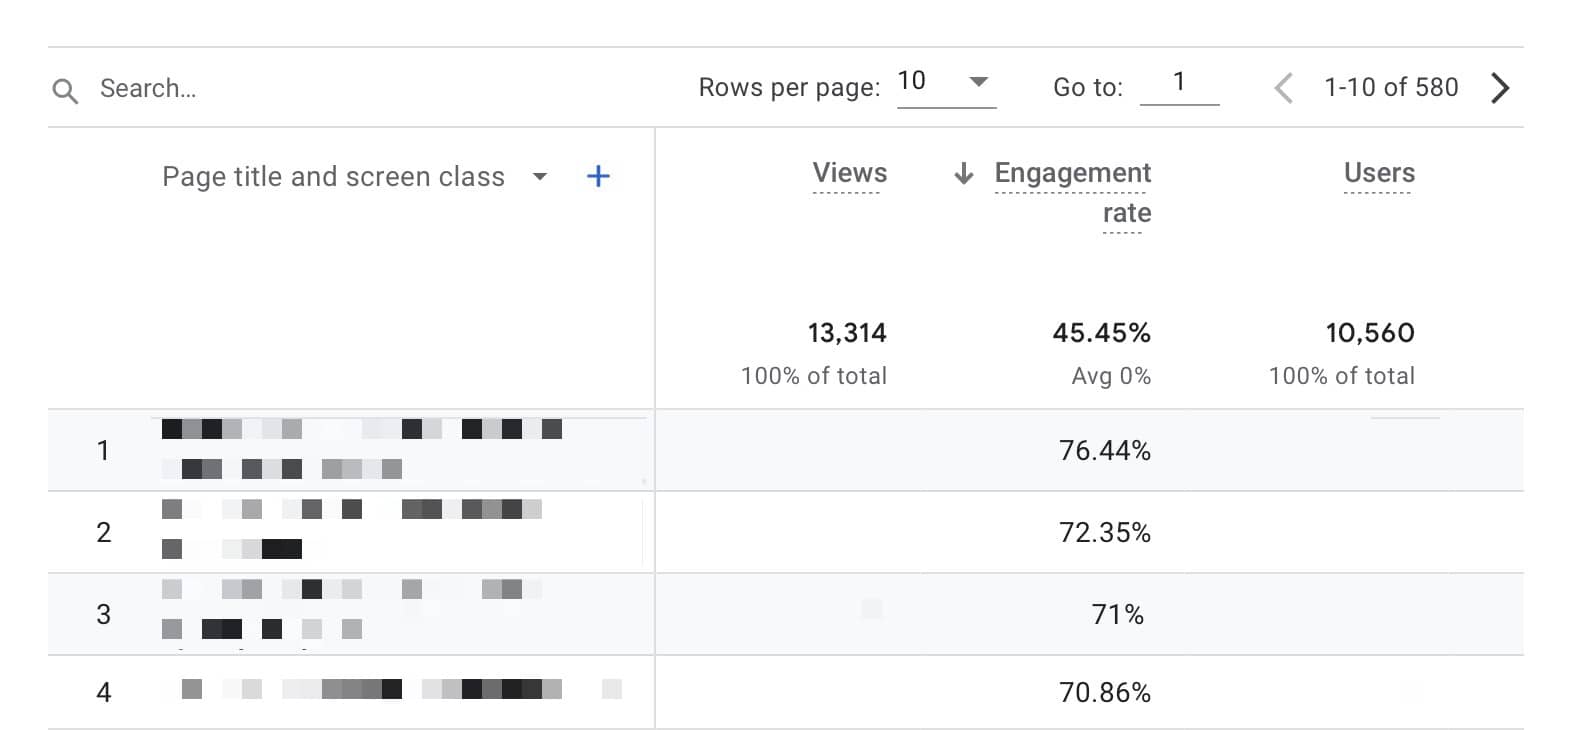
Step 5: Check Engagement Rate Metric Per Page
Go back to Pages and Screens, and scroll down.
Since the engagement rate is calculated based on your website’s pages, you will be able to side-scroll to find it.
Remember that the engagement rate will be expressed in percentage.
That’s how you find your page’s engagement rates on Google Analytics 4.
It is also possible to add Engagement Rate and other engagement data to Traffic Acquisition reports.
FAQ
What’s the Difference Between UA and GA4 Bounce Rate?
According to Google, bounce rate in Universal Analytics is the “percentage of visits that did not interact with your site,” whereas bounce rate in Google Analytics 4 is the “percentage of sessions that were not engaged sessions.” In GA4, bounce rate is measured through the triggering of events, whereas UA’s bounce rate is measured based on page interactions.

BIO
Paul Jarvis, author + designer