Website analytics that matter (and why they matter)
Paul Jarvis · Mar 29, 2022It can be easy to get overwhelmed with what website analytics data you should pay attention to in your business.
And while website analytics are super valuable for small businesses, agencies, bootstrappers and more, it can feel a bit like information overload sometimes (especially if you’re using Google Analytics, which is super complicated).
Reading your website analytics doesn’t have to be a full-time job or require taking a 6-week course. A few minutes a week can give you a strong signal on what’s happening and what’s working (or not working) on your site.
This is why Fathom Analytics has always focused solely on “metrics that matter the most” and worked hard to ensure those metrics are simple and easy to understand. We know business owners are busy, and we don’t want them to take more time than they should to figure out their analytics.
Here’s our quick guide to what website analytics matter, why they matter, and how we can use those metrics to make better business decisions.
How many people are visiting your website?
Your website’s effectiveness is measured in several ways, but one of the easiest ways to consider if your site is doing well is by looking at your month-over-month website traffic.
When talking about web traffic, you can mean pageviews (total times any page on your site is visited) or visitors (total number of actual people who visit your site).
For the most part, visitors are the metric that matters here, as it gives you an idea of how many real people are visiting your website. And if you compare month-to-month visitors, you can see if your website is getting or fewer people visiting it.
The reason we suggest looking at months vs months instead of days or weeks is that there can sometimes be spikes that can make it hard to compare smaller periods (anything from viral tweets to someone sharing a link to your site on a big sub-Reddit). But if you think in terms of months, you should hopefully get a similar enough number of spikes from your marketing to make the comparison of month-to-month reasonably accurate.
How Fathom helps you understand visitors
In Fathom, if you set your dashboard to “This year,” “All time,” or a custom range that includes many months, the graph will update to show you the month-to-month comparison of visitors.
Hopefully, the graph is going up (in general) from left to right. If it’s not, it’s time to work on your marketing and content strategy to drive more people to your site.

Fathom also offers monthly email reports which show you the visitors for the month that just happened (and besides that number, the comparison of the previous month). We also have unlimited data retention, so you can compare your month-to-month visitor numbers from the date you signed up for Fathom to right now, even if that’s 4+ years of data.
What do people do on your website?
Once you’ve got a grasp on the overall growth of your site, you can drill in a little bit and figure out what people are doing once they visit your website. This helps show you which pages are the most popular (and conversely, which pages aren’t getting as much traffic as you want them to).
By knowing this, you can adjust either your content or your internal linking to drive more traffic to important pages or know which pages are the most popular on your site (so you can focus your attention on them).
Combined with knowing how popular your pages are is knowing what your bounce rate and average time on pages are. This helps you fully understand if people are reading your content or simply leaving quickly.
Bounce rate is the number of folks who visit a single page on your site and then leave without clicking on any other pages. So if ten people visit your site and five of them don’t click another internal link (i.e. they leave), your bounce rate is 50%. If your bounce rate is high on your homepage, it could mean that the wrong types of people are visiting (ones that don’t want what you’re promoting), which means you may need to adjust your strategy for driving visitors to your site. Or it could mean your content is confusing or not engaging enough, meaning you should rewrite it. Or your bounce rate would be 100% if you have a single-page website.
Time on the page tells you how long people spend on each page. This can help you figure out if people are sticking around long enough to read your content (i.e. if your average time on page is a few seconds, but you write long-form content, that means people aren’t reading whole articles).
How Fathom helps you easily understand what people are doing on your site
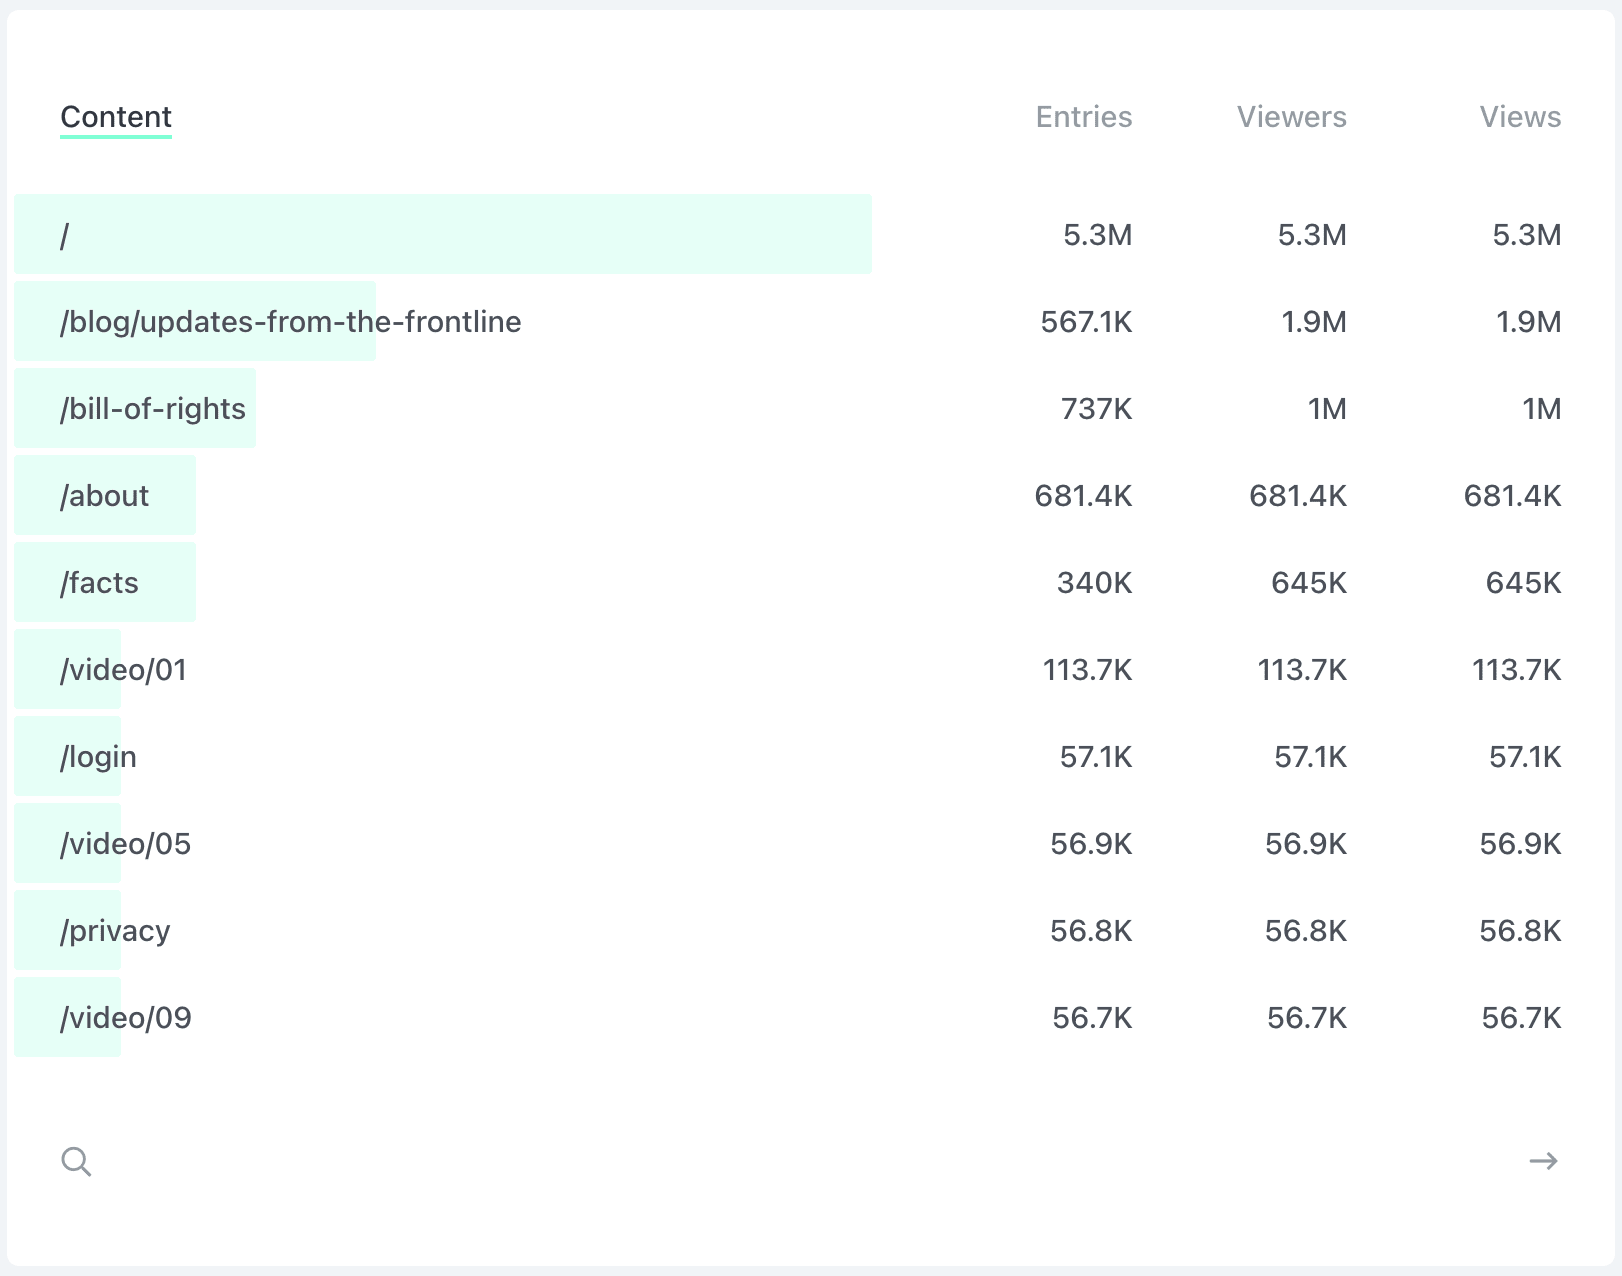
The first box in Fathom’s dashboard is “Content,” which shows you the content people are clicking on in order of popularity. Fathom also surfaces “entries” as well, which is the number of people who landed on each page as their first pageview on your site. Entries are helpful to know as those are the pages people first see (so are they bouncing or sticking around from there?).

You can also search your content (by clicking the magnifying glass in the Content box) or filter your content.
To filter content, click on the content, for example, /about, and your whole dashboard will then filter to only show you data that relates to people who visited /about. For example, if you see your total average time on site is 2:00 and your bounce rate is 60%, but when you filter by /about, those numbers change to 4:00 and 20% respectively, that means people are sticking around longer than average on that page and are more likely not to bounce. This helps tell you which pages are your strongest, so you can adjust weaker pages to be more similar.
How do people find your website?
When talking about how people find your website, we’re talking about referrals. Referrals are the website or place someone clicked from to get to your site. So that can be Google (their search engine), another website or social network, or even an email.
Knowing how people are finding your site (where they are coming from) helps you understand what’s working or not in building awareness about your site. For example, if you tweet a lot and mention your articles, you should see a high number of Twitter referrals. If you spend a lot of time on SEO, you should see an increasing number of referrals from Google. This can help you understand where you need to adjust (or even abandon) marketing strategies.
How Fathom helps you understand referrals
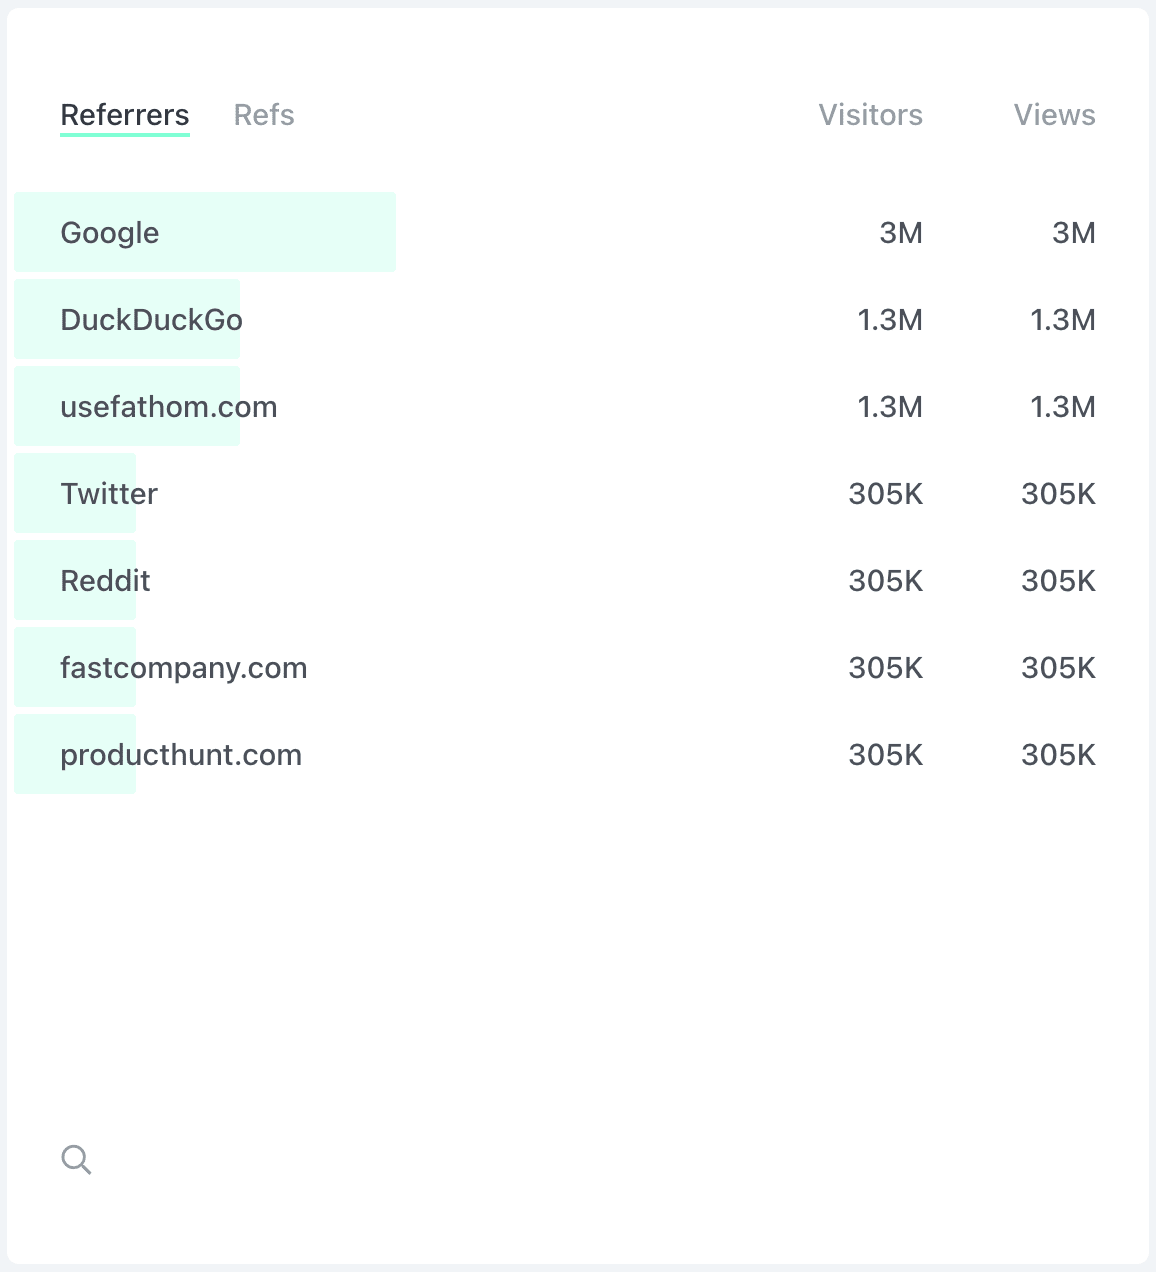
A box on the Fathom dashboard for “Referrals” shows you exactly what sites and sources are sending your site traffic. They’re sorted in order of traffic, so you see your most popular referrers at the top.

You can also click on any of these referrers, and it’ll filter the dashboard to show you only data that came from that referrer. For example, if you have a referrer for “Reddit” and you click it, your Content box (and everything else) will show you only pages on your site visited by people who came to your site from Reddit.
Some places remove or delete the referrer when sending traffic to your site (Facebook and newsletters, for example). These are considered “dark traffic,” which means no referring website is sent to your analytics. But fear not! Fathom accounts for this by letting you add UTM tags to links. By doing this, you can create your own referral data in UTM tags to see where people are coming from (by using links to your website with UTMs in places that remove referrer data).

So if you have an email going out to your newsletter, you can use UTMs to track how much traffic came from that link (even though newsletter links don’t send referrer data), like so:
yoursite.com/?utm_medium=email&utm_source=newsletter&utm_campaign=mar01-sendoutOr, if you’re running several ads and wanted to know which were converting the best, you’d use slightly different UTM tags for each ad:
yoursite.com/?utm_medium=cpc&utm_source=google&utm_campaign=campaign01
yoursite.com/?utm_medium=cpc&utm_source=google&utm_campaign=campaign02
yoursite.com/?utm_medium=cpc&utm_source=google&utm_campaign=campaign03
And then, in Fathom, you could look at your UTM tags for campaigns and see which of those three ads drove the most traffic or converted to the most sales.
We’ve even built a simple UTM generator for you to use.
Are people converting?
Driving traffic to your site and growing the number of visitors is typically step one. Having that traffic complete the tasks you’d like them to do generally is what site owners focus on next. We’re talking about tasks like signing up for a newsletter, starting a software trial, buying a product or products, etc.
Site owners typically track the events that matter to their business, like new leads or new sales. These are called “Goals” In Google Analytics or “Events” in Fathom Analytics.
When a goal or event happens, that’s a “conversion.” Meaning a person did the task you were keeping track of. These conversions matter because they can show you if people are doing what you want them to do once they reach your site.
How Fathom helps you simply understand conversions
There’s a box on every Fathom dashboard called “Events” this is where you’re able to track conversions. Most customers use events to track conversions of things that matter to their business. For example, specific button clicks, e-commerce sales (and the value of each sale), or even just loading significant pages.
If your site is a blog, newsletter signups may be your most important conversion rate. If you sell products, then e-commerce sales may be your most important event to track. If you sell SaaS, then trial signups (and then paid conversions) may be the events you’d most like to track. All of these tasks can be created as events in Fathom.
Conversion rates in Fathom are calculated by looking at the total number of page views on pages with an event and dividing by the number of times that event was completed (i.e. the button was clicked, the page was loaded, the form was submitted, etc.).

Note: Right now, if you filter by UTMs, you'll see the Events box filters by that UTM tag you clicked on. We're adding full Event filtering shortly (within the next few months).
Conclusion
While web analytics can feel overwhelming when you start using them to help make intelligent business decisions, the key is to start slowly. Look at a single metric and get a good understanding of it. Then decide if it’s actually a metric that makes sense to track in your business. All metrics aren’t useful to everyone. For example, bounce rate doesn’t matter if you have a single-page website because it always has a bounce rate of 100%. What’s critical is figuring out which handful of metrics matter most to the success of your business, then figuring out how to learn from them every month and use that data to help tweak, add or update the content on your site.
And of course, if you feel intimidated or overwhelmed by Google Analytics, Fathom is simple web analytics and a great Google Analytics alternative.
Our software is a single page of easy-to-read data, and thousands of customers choose us for reliable and GDPR compliant analytics. Start with a 7-day free trial and see how much easier it is to learn from the metrics that matter by using Fathom Analytics.
You might also enjoy reading:
BIO
Paul Jarvis, author + designer